Access to group-wide data in Excel: flexible reporting at STIHL
Designing flexible, tailor-made reports in just a few minutes without having to manually prepare data is a dream of many treasurers. STIHL found its solution using the TIP Cube from TIPCO and defined new benchmarks in treasury reporting in the process.
The age-old problem with treasury reporting is that setting up reports takes time and money. Large Excel files with flexible data capturing features need to be prepared and sent to subsidiaries in order for these to enter the necessary data. The next challenge is to collect the data, identify and correct any formatting and data capture errors and to compile the data.
It is often necessary to add additional data from various source systems to the information provided by the subsidiaries. No end of time passes before you have finally gathered all the data for the analysis in question, time which should have been invested in the analysis rather than data preparation.
There is also the issue of costs: Even if reports have been cost-intensively programmed for specific purposes, requirements tend to change over time, making it necessary to again appoint an external consultant. And the dream of being able to respond rapidly to ad-hoc requests remains exactly that, a dream.
Raise the speed, improve the data
These shortcomings bothered us for many years. That’s why we set up a basis for centralized data management in the STIHL treasury department several years ago. Based on the existing TMS (Reval), TIP was launched as an on-top solution. Since then, we have been automatically gathering the data of all group subsidiaries at head office and preparing pre-defined forecast and status reports at the press of a button.
The new opportunities offered by digitalization allow us to continue increasing the already high level of automation. Every Monday, STIHL Treasury provides management with a dashboard report which highlights the current level of liquidity within the group from various perspectives. In the past, we had to manually copy and paste all of the data from other existing reports into a separate spreadsheet with numerous pre-defined formulae, a task which took half a day.
Our long-standing system partner TIPCO came up with a solution to this challenge. TIPCO developed just the right tool, the TIP Cube, which allows us to design and automate ‘self-determined’ reports which flexibly reflect our requirements and which, most importantly, are based on Excel. We gave the green light in early 2018 and in under five weeks we had exactly what we needed.
No more blue mondays
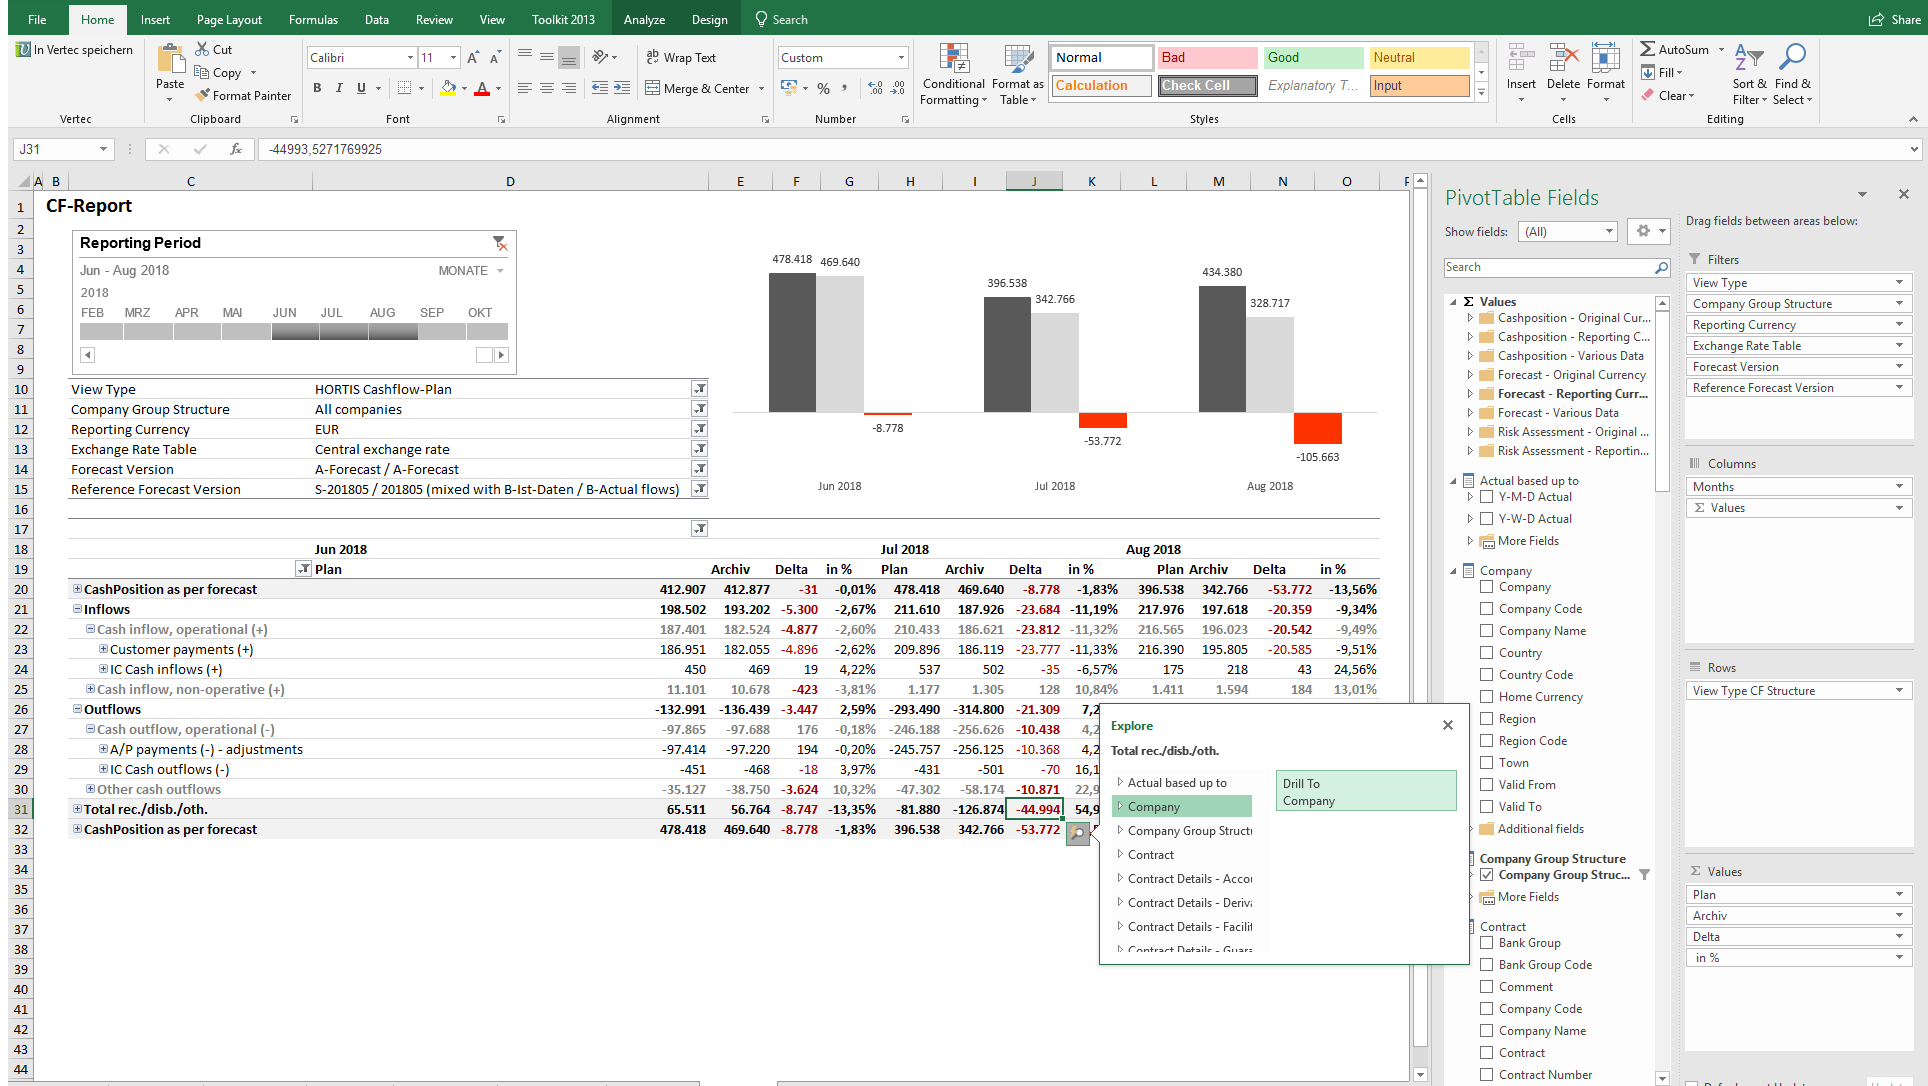
Our Monday Morning Report, designed in-house, is now updated at the press of a button and can be modified without external support. The biggest advantage of the TIP Cube makes this possible: It provides access to all of the group’s data in Excel so that we can build our reports directly in a system we are all familiar with. Based on the current data, completely flexibly and with the formulae, diagrams and other functions we know inside out that Excel provides (see Figure 1). It is no overstatement to claim that reporting is now really fun. We filter the financial status to reflect our needs, by subsidiary, counterparty or currency. We can define which effective date we want to see data for, but can also work with ‘dynamic intervals’, meaning that the report includes the previous working day, month or quarter.
Dashboards with minimal effort
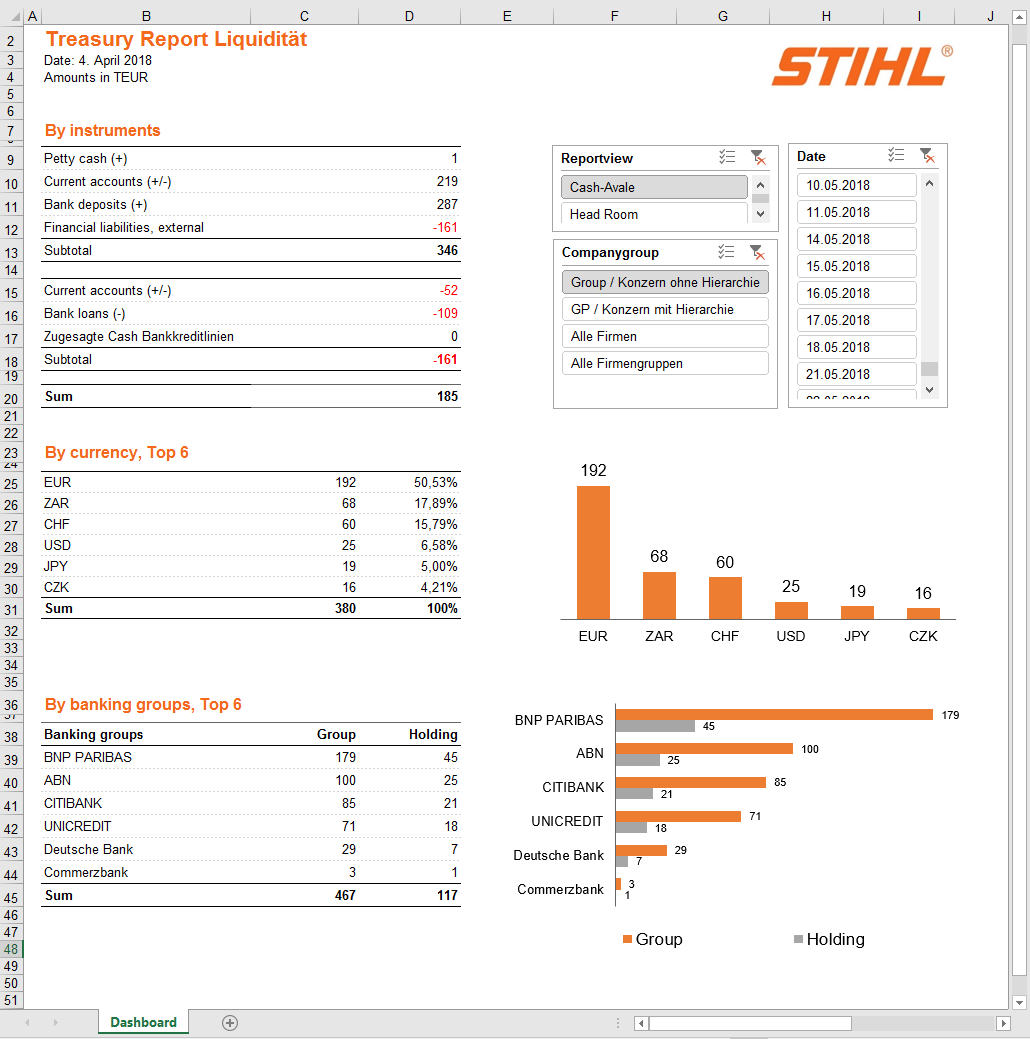
A key reason why we opted for the TIP Cube was the current status of the data. The Cube provides us with the current data at the defined intervals (e.g. hourly), just the way these are managed in TIP. Every time we access the data, the dashboards show us the latest group-level information without us having to make any manual entries (see Figure 2). And if we want to do an ad-hoc analysis of how the various positions are made up, we simply drill down in the report. The drill-down function allows us to access even the lowest data level and to compare the relevant positions here. Thanks to the Cube, we now have the time we need to do the in-depth analyses which are the key to real value added.
Figure 1: Data in Excel = reports in Excel
Report with plan/actual comparison: The TIP Cube allows you to use the Excel pivot function to access your current group-wide data and to base detailed analyses on these. The drill-down function allows you to access even the lowest data level.
Figure 2: All your data at a single glance
The TIP Cube displays your current data in TIP, and therefore keeps the dashboard report up-to-date without having to manually process data.
About the authors
Ingo Schorn is head of treasury and Katja Lehner part of the treasury front office at ANDREAS STIHL AG & Co.KG, part of STIHL KG. Dominik Scheitz is a consultant at TIPCO Treasury & Technology GmbH.