The necessity of real-time cash flow dashboards
During the worst of the economic turmoil caused by the coronavirus, companies felt the full benefit of instant access to real-time data
During the worst of the economic turmoil caused by the coronavirus, companies felt the full benefit of instant access to real-time data
Treasury and finance professionals will take many lasting lessons from the tumult of 2020, and the absolute necessity of having instant access to their real-time cash and liquidity data is likely to be chief among them.
At its height, the fallout from the rapid spread of the coronavirus was unfolding almost by the hour. Businesses had to react accordingly, and those who had immediate visibility over their current and projected cash and liquidity positions were better placed to do so.
With senior management expecting daily updates on cash flow data and KPIs, piled on top of their already considerable cash reporting requirements, the pressure was on head office treasury and finance teams to relay that information with exceptional speed and clarity.
It is during these charged situations that the true value of a cash flow dashboard becomes abundantly clear.
Cash and liquidity dashboards display live data, generated by cash reporting and forecasting systems and processes, that is most important to businesses and their stakeholders. What’s more, they focus all eyes on a single version of the truth that can be easily understood and digested.
With the touch of a button, dashboards can also be rolled into reports and delivered to senior management, who have the option to take a headline view or drill down to the most granular level of detail.
A cash flow dashboard, however, is only worthwhile when fulfilling a specific purpose. Companies must first identify what KPIs best reflect their financial performance, and are therefore worthy of a spot on the dashboard.
Dashboard metrics and KPIs
KPIs differ from business to business. But in our experience here in CashAnalytics, where we provide cash forecasting and liquidity planning solutions to multinational organisations across the globe, the following five metrics generally, though not always, take centre stage on the dashboards:
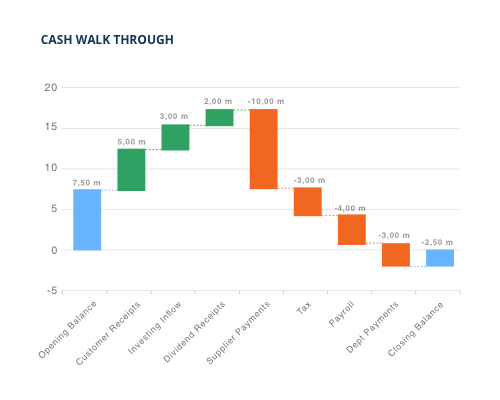
A cash walkthrough allows companies to visualise all the steps that were taken between an opening cash balance to a closing cash balance. The journey is segmented into a series of stages that present what has affected, positively or negatively, the net cash balance.
Using a graph to visualise the pertinent information, headline cash inflow categories, such as customer receipts and investing inflow, are colour-coded. As are the primary cash outflows, which may include supplier payments or tax.
A primary benefit of visualising data in this way is that it underlines the impact every cash flow category has had on the cash balance. For instance, with a cash walkthrough graph, a treasurer or financial planner could immediately spot that supplier payments had negated the combined contribution of customer receipts, investing inflow, and dividend receipts.
Large businesses, especially those with a worldwide presence, frequently struggle to achieve a current, single-currency centralised cash position, presenting both current cash levels and forecast cash levels at particular points in the future.
This is hardly surprising, considering the amount of subsidiaries and bank accounts involved. With bank data and forecasts loading directly into the dashboards, however, a real-time view of daily consolidated actual and forecast cash positions is instantly available.
These consolidated actual and forecast positions – with the data sitting behind them related to business units, bank accounts, and many other aspects of the company – are the foundation for all additional cash reporting
Again, the sheer number of moving parts makes calculating current and forecast liquidity very challenging, though not out of the question. Liquidity reporting layers external sources of available liquidity on top of available internal cash reserves.
During the worst of the pandemic, companies tapped into these liquidity reserves as they sought to add another layer of security by turning as many of them as possible into cash.
Most large companies will have several sources of external liquidity throughout their organisations. Concentrating these liquidity sources, then combining them with cash reserves to show total available actual and forecast liquidity, is a must for dashboards.
Though not strictly cash and liquidity metrics, net debt and covenant metrics are closely related to cash and liquidity and should not be overlooked. Cash and drawn liquidity are essential pieces of the net debt figure and, ultimately, covenant calculations.
Major movements in cash flow over a short period, or more gradually across time, have a significant effect on net debt and covenant levels, especially if underlying earnings are not headed in the right direction.
This will potentially constrain a company’s capacity to access liquidity and to use the cash generated in the way it was initially intended (e.g. cap-ex.). Due to their significance, net debt and covenant figures must be highlighted for the benefit of all relevant stakeholders.
It may seem counterintuitive to highlight actual versus forecast differences and variances on a dashboard seen by executives and other senior stakeholders. When properly managed, however, it can add huge credibility to both the overall cash reporting process and the dashboard itself.
Furthermore, highlighting and explaining a large variance puts the dashboard owner, typically the head office finance or treasury team, in control of the function by heading off unavoidable questions before they are asked.
Providing high-level forecast variance analysis on the dashboard helps all consumers comprehend the major primary items influencing forecast accuracy and guarantees the caliber of the data is consistently tracked
This is just a small sample of the metrics and KPIs that are trackable, in real-time, on cash flow dashboards. Many of our clients have chosen to include myriad other KPIs, namely working capital and cash conversion cycle metrics, to add greater depth to their dashboards.
The common denominator is, needless to say, the dashboard. Because they give companies a clear pathway to explore and understand their financial past, present, and future.
CashAnalytics is a comprehensive cash flow forecasting software solution used by medium to large-sized corporates for their cash forecasting, reporting, and liquidity planning activities.