FX risk: Identifying exposure through a Currency Map
Risks from changes in FX rates can be all pervasive and affect the competitive position and the general economic environment firms operate within. Here we look at a technique called the Currency Map, a fundamental tool in identifying FX exposures within firms that operate in multiple territories, are exposed to the import or export of goods and services, or have substantial intra-group trading
Identifying underlying FX exposures within a business is often one of the most challenging issues a treasurer will face. This is an area where it is necessary to communicate across multiple functions and territories, and where accounting, tax and even performance management objectives can drive a substantial number of complexities and misunderstandings. Most international businesses work with a budget rate, which while creating many benefits can also relegate currency risk to that of a background issue for many in the business. Designing and then implementing the most effective and pragmatic policy is often a challenging process.
A core technique for identifying FX exposures within a business is the Currency Map. Put simply, it is an alternative consolidation of business performance based on the underlying currency of cash flow within its operations. For FX risk management purposes, a Currency Map is far more insightful than a consolidation performed through each reporting entity within the group in its own functional currencies.
In the context of a Currency Map underlying currency of a cashflow is not necessarily either the functional currency of an entity or even the currency that invoices are received or issued in. Sometimes an invoice might be issued in the functional currency of one or other party to the transaction but be based on pricing in another currency and simply converted at a current exchange rate. In this case there could be two currency exposures: the first a long-term exposure to the currency underpinning the good or service purchased, the second a short-term transactional exposure to an outstanding receivable or payable. The former is by far and away the greater FX exposure, but it is potentially masked by the less significant currency of invoice.
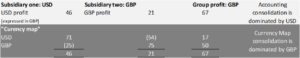
A Currency Map in its most simple form is a schedule of currency income and costs within each entity in the group. When consolidated this creates a net exposure for each currency the group transacts in. The box below shows a group expected to make a consolidated cash inflow of £67m in the next year. The group consists of two subsidiaries, subsidiary one is a USD entity and is expected to contribute £46m to this total (in USD equivalent), while subsidiary two is a GBP entity expected to generate a cash inflow of £21m. A Currency Map perspective however breaks down the expected cash performance of £67m into £50m arising from GBP cash flows, and £17m from USD cash flows. Some substantial non-functional currency cash flows exist within the two subsidiaries with the USD subsidiary incurring GBP costs, and the GBP subsidiary incurring USD costs.
A currency map breaks down the consolidated result (£67m) by underlying transactional currency. In this case that is £17m USD equivalent and £50m GBP. A traditional accounting consolidation shows £46m profit recorded as USD and £21m profit recorded as GBP through subsidiaries one and two.
This situation gives rise to several areas of FX exposure:
There is a translational exposure from the subsidiary one, based on the average USD exchange rate over the year. Commonly international group’s simply live with this exposure to their consolidated profit and loss account because their shareholders accept it as part of their investment case.
There are transactional exposures in both subsidiaries, with subsidiary one needing to buy £25m of GBP and subsidiary two needing to buy £54m of USD equivalent. Traditionally these exposures have been covered to protect the profit and loss account in each subsidiary from a direct FX gain or loss.
There is an economic exposure over the medium to longer term: a strengthening of USD against GBP would affect the profitability of both subsidiaries and the group but could also change the competitive environment.
Transactional vs. Currency Map hedging
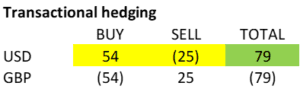
The example below shows a risk management approach based on the transactional exposures within each subsidiary aimed at protecting their individual financial performance. However, this does not always produce the best result for the group and involves:
A combined total of £79m of FX traded across both subsidiaries
A net position whereby the group is buying £29m of USD equivalent
This example shows the transactional hedges required in each subsidiary
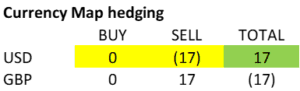
A hedging strategy based upon the Currency Map produces a very different result and is shown below. The group need only sell £17m USD in total, i.e. the net USD exposure identified by the Currency Map, to fully protect the consolidated cash inflow of £67m. This is regardless of any gains or losses from transactional exposures in the subsidiaries.
This example shows the hedges required based upon the next Currency Map position
What the Currency Map achieves is fundamental clarity over the net currency flows behind the group’s operations regardless of which entity they arise in. Our small group has a substantial USD functional currency subsidiary and, therefore, this currency dominates the traditional accounting consolidation. However, both subsidiaries have material transaction exposures within them and when these are identified using a Currency Map the group’s profits and cash flows are shown to be clearly dominated by GBP. Net USD cash flows are a smaller influence on the group’s results, but this is certainly not obvious from an entity led consolidation approach and of potential concern is whether the group itself or its investors fully understand the FX risk they are exposed to.
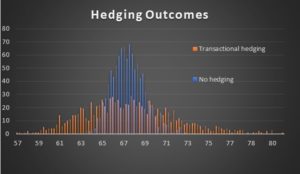
Now the question for the treasurer is what is the FX exposure that needs to be managed within the group? Those of you who have read this series of articles from the start will remember that I covered Monte Carlo simulation and its usefulness in the opening article, and this is a great example of its relevance. An approach of hedging transactional exposures within each subsidiary or doing nothing has been tested, and the results are clear: transactional hedging within each subsidiary, as illustrated, substantially increases risk with an average spread of cash flow outcomes of 10 percent against the expected result. If a “do nothing” approach is taken, then the average spread of cash flows around the expected result is only around four percent. A risk management policy based on hedging the transactional FX exposures within each subsidiary substantially increases the overall risk to the group’s cash flow results.
Applying a Monte Carlo simulation to example produces demonstrates how a transactional hedging policy in each subsidiary actually increases risk compared to doing nothing.
The conclusion demonstrated above requires an explanation because it may seem counter intuitive. Surely, I hear you cry, reducing FX risk within each subsidiary by hedging their individual transactional currency exposures, you must also be reducing the overall risk to the group’s cash flow result as well? The issue that arises when the group adopts a transactional hedging approach is that its biggest subsidiary operates in a USD functional currency. The group should really be concerned about the USD cash inflow, not the GBP cash outflow, in this subsidiary. In fact, the transactional hedges in both subsidiaries inadvertently increase the group’s FX risk to its consolidated cash flow result.
There is a third risk management strategy, however. Testing our Currency Map hedge under the Monte Carlo analysis produces a result under every FX permutation equal to the expected cash flow result of £67m. The Currency Map has allowed us to identify the technically perfect hedge, eliminating any FX risk to the expected group cash flow performance.
However, some considerations to bear in mind before cracking open the champagne include:
The hedge only works perfectly if the underlying currency cash flows materialise as planned.
The solution to this is often to only hedge up to a certain level of the forecast currency flow.
The group might argue that investors actively pursue the translation exposure of the USD subsidiary into GBP.
True, they might. But do they appreciate the exposure is £17m USD equivalent not £46m?
They almost certainly do NOT want the extra exposure that the transaction-based hedging policy produces as this increases overall FX risk needlessly for zero expected return.
Over a horizon period greater than a year the exposure to the USD is still present. The Currency Map hedge protects the group’s cash performance over the current year, allowing the FX exposure to permeate through to the cash performance over an extended period and giving the business the opportunity to adapt if necessary.
It is even possible to combine the two hedging approaches to produce the best of both worlds. Internal FX deals could be set up within the group between subsidiary one and two with let’s say a treasury entity to offset their individual profit and loss account exposures. This hybrid approach will be discussed in the next article in which we develop a more sophisticated overall response.
The last point to make is that I have deliberately talked about protecting cash flow performance in the context of the group’s result and not the profit and loss account. Firstly, this is because cash flow is the ultimate driver of valuation. Secondly, hedges against individual transaction exposures in an entity dull the visible line item FX gain or loss in the profit and loss account. However, it is easy to explain. Even a “do-nothing” approach has a simplicity about it that makes it uncontroversial. But the Currency Map hedge can produce FX gains or losses in the profit and loss account that might be harder to explain or to manage through the accounting hedge relationship rules. This is despite this combination of transactional gains and losses and the translation of subsidiary one (USD) into GBP ensuring that the group removes FX risk altogether. The Currency Map hedge combination achieves the expected cash flow result for the year.
The Currency Map, therefore, is a hugely useful tool in determining the best hedging approach to take within a multi-currency situation. It comes into its own when underlying currency cash flows differ substantially from the functional currency of the subsidiaries within the multinational group. A hybrid risk management approach can be taken whereby transactional exposure is mitigated at subsidiary level and a group overlay is put in place to manage the net exposures identified by the Currency Map. We will discuss this and other considerations in detail in the next article.