There are many factors to consider when designing an overall FX risk management policy. Here we explore the process of analysing the impact of each and then bringing them together in a policy that manages risk effectively
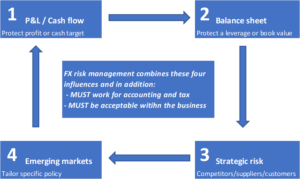
In the three preceding three articles we have explored several aspects of FX risk exposure and discussed ways of analysing and mitigating them. These areas are illustrated in figure one.
Figure one: FX risk policy must balance several different economic objectives as well as being a practical solution within the business.
A common tool throughout has been the Currency Map, and this, combined with Monte Carlo simulation, is often a critical technique in determining the “best” answer for each type of risk. However, the interaction of the four areas listed above can lead to contradictory responses. For instance, risk exposure to cash generation for a set period may be mitigated by using foreign exchange contracts or paying down currency debt. However, a balance sheet leverage target of net debt to EBITDA, which is often a critical credit metric, may require a different mix of currency debt in order to manage effectively.
Another element to the challenge is the accounting and tax treatment arising from the policy. Often the objective of these concerns is to minimise direct foreign exchange gains or losses in the income statement which can appear both internally and externally as “poor management”. These direct gains or losses are also often taxable or potential blocks to the movement of upstream dividends in a group. The accounting standards impose additional restrictions on the approach with complex rules around whether FX gains or losses can be taken to reserves or not. Often the accounting standards require currency exposures to be matched against book assets and these sometimes have little bearing to the economic FX exposures the Currency Map reveals. The treatment of foreign exchange gains and losses arising from inter-company balances being can be particularly challenging in this area.
As though the above is not enough there is a soft side to FX risk management, involving the internal messaging and communication and the external presentation of exposures and performance. For example, operational management often see local FX gains and losses as very unwelcome, or worse, sometimes attempt to play the FX market if a currency movement is working in their favour and improving results. It is no lie to say the author has heard comments along the lines of “can we take credits to the p&l and debits to reserves”, and “foreign exchange doesn’t impact us as we look at everything at budget rate”.
Developing an understanding of the underlying currency exposure can be difficult if transactions occur in one currency but the underlying good or service is effectively priced in another. Short term currency exposures can be mitigated by insisting suppliers or customers transact in the functional currency of the entity, but this does not remove the currency exposure in the medium to longer term if this is the case. It is this longer term movement in foreign exchange rates that can erode margins and even competitive positions over time. It is important that the FX risk management policy can buy enough time for the commercial response to take effect.
Table one summarises some of the varying concerns that an FX risk management policy often has to address.
Table one: foreign exchange risk management responses have a technical, accounting and “soft” dimension to them.
From this discussion it is clear that it is often far from straight forward to determine the actual policy to put in place. Developing the technically best solution is only a starting point when implementing a foreign exchange risk management policy. The treasurer needs to take a pragmatic approach considering what will work within the business and illicit the buy-in required from operational and senior management, and a blessing from the accountants to best address the risks areas identified.
Identifying the risks
If the challenge of creating an FX risk management policy seems a little overwhelming, then in practical terms where do you start? Put simply, if there is any degree of complexity involved, start with a Currency Map. The important point here is that the Currency Map must reflect the underlying currency exposure which may not be the currency in which transactions are recorded in the accounts. This may mean that customers and suppliers might transact in the firm’s functional currency, but the prices being set are dominated by another currency. Are they then simply passing through FX exposure in the prices the firm sees by converting their prices at a spot rate? If prices appear fixed in our own business is this because the supplier has built in a margin to cover their own FX exposure?
The key principle when producing a Currency Map is to consider this underlying currency exposure. This can be further complicated when the dimension of time is bought into consideration. Supplier prices may be fixed for a period in our firm’s functional currency, but over the medium term these will be influenced by FX movements if the source of the supply is linked to another currency. A common example here could be that the marketplace might be heavily influenced by another currency: a firm involved in markets with substantial commodity inputs will be influenced by the USD FX rate regardless of whether it sees its supplier prices in its own currency. Indeed, when the commodity price is only a part of the total cost, estimating the degree of FX exposure can become an extremely challenging concept to explain and analyse.
Figure two: mapping out the underlying currency flows reveals a different currency mix constituting the Group’s performance compared to the functional currencies of the Group’s subsidiaries.
Let’s start by creating our currency map. Figure two illustrates a simple group structure consisting of four entities. All values are shown as GBP equivalent. The currency map reveals a very different picture of this group’s currency exposures compared to that which is visible from a traditional consolidation built around the functional currency of each entity. There are significant non-functional currency cash flows within the subsidiaries which means that the actual currency profile for the group’s EBITDA is very different from a consolidation consisting of a consideration of subsidiary functional currency only. It would certainly not be clear looking at the functional currency consolidation (left hand side of figure two), that nearly half the group’s EBITDA arises in Euros, as the USD subsidiary books the biggest profit. Dollar costs must be “hiding” elsewhere in the group bringing down the overall level of USD contribution towards EBITDA when compared to the subsidiary profit .
Building a model
The next step is to build a model replicating the cash and profit performance of the business defined in currency terms. The model needs to achieve several things:
Replicate expected business performance at expected FX rates.
Deliver key outputs such as revenue, operating profit and EBITDA.
Reflect cash performance with elements such as CAPEX and working capital also defined in currency terms
Lastly, deliver a closing debt figure based on this cash performance
It may be that other metrics and KPIs are important for the business and these should be incorporated in the model.
With a currency map and a model in place then we revert to my favourite tool in risk management: Monte Carlo simulation. The beauty of this tool is that it is so flexible especially when addressing the exposures we often encounter in treasury. These can have a unique combination of market related inputs, such as FX rates, technical requirements such as accounting treatments and then economic outcomes such as cash flow, net debt and EBITDA. Bringing these together under a combined model and then testing the output under 1,000s of randomly generated inputs really brings to life the extent of the risk. It allows various solutions to be tested. In particular hedging solutions such as options can be incorporated, and if like me, the thought of explaining and justifying an option to the CFO fills you with dread, being able to show outcomes on real metrics and KPIs through a Monte Carlo simulation certainly helps make the proposition more understandable and real.
Where next?
In this article we have covered some general themes around building a coherent FX risk management policy. We have also introduced a very straight forward group structure with contrasting currency mixes within its structure when looked at from a functional currency versus currency map perspective. Clearly there are FX transactional exposures within each entity in the group.
In the next article we will step through the process of deriving an FX risk management policy for this group, balancing the differing priorities of reducing FX volatility in the profit and loss account, the balance sheet leverage ratio and considering the emerging market currency exposure from the Brazilian Real. Lastly the strategic element is addressed by setting this in a global context where competitors have different currency cost and revenue bases to analyse what effect extreme currency movements would have on our group’s competitive position.