The table below summaries the main process steps involved in the formulation of an FX risk management policy and the four impact areas that require consideration and should be addressed.


Figure one introduces a simple multinational group. The group makes EBITDA of £235m dominated by its USD subsidiary. However the underlying currency cash flows, made transparent by the currency map, are very different.
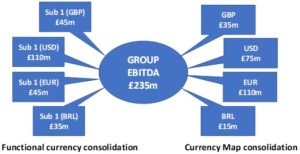

The currency map reveals that Euros account for nearly half the EBITDA (£110m of £235m), and the USD contribution is much lower (£75m) because the group has a significant underlying USD cost exposure in all of its subsidiaries. In addition there are some BRL costs in the USD & EUR subsidiaries and the GBP subsidiary derives some sales from Europe directly.


This currency profile has significant implications for any FX hedging solution to manage these exposures.
P&L and cash flow stability
EBITDA is identified as the core KPI as it forms both a major component of the profit and loss account and the cash flow statement and is also a key credit metric. There are three broad approaches to managing the effect of FX on the profit and cash flow. These approaches are to:
- Manage at a transactional level in each subsidiary. This involves fixing currency exposures in each subsidiary against the functional currency of that entity
- Manage at a group exposure level based on the Currency Map. This involves a central overlay fixing net currency exposures to the group’s reporting currency
- Do nothing and allow FX gains and losses to arise both from transactions within subsidiaries and the translation of foreign currency results into the group’s reporting currency.
The first two approaches outlined above can be combined by using internal hedging and a group overlay expanding on a traditional inhouse banking approach.
These three approaches have been tested for our group using a Monte Carlo simulation to generate thousands of random currency movements over the course of the reporting period. Figure two shows that managing the FX exposures only at a transactional level in each subsidiary (approach 1) creates more FX induced volatility in the group’s reported EBITDA than doing nothing at all (approach 3).
The group based (2 above) of hedging FX exposure based on the consolidated currency map, fixes the group’s EBITDA at the expected value of 235, assuming of course the business delivers the operational results precisely to expectation. In reality a practical approach to implementation would be to hedge up to a certain level of the expected results.


In conclusion a group based hedging programme based on the aggregate currency map gives certainty of EBITDA outcome over the course of the period. Of course this does not mean that the group has removed exposure from FX movements in future years. There are two other advantages to this approach:
- The aggregate amount of hedging is lower than the transactional approach which results in lower execution costs.
- The group approach can be combined with a transactional approach at the subsidiary level using internal FX swaps between the operating subsidiaries and a central treasury entity.
Balance sheet exposure
The second core area an effective FX risk management policy must address is the impact of FX exposure to the balance sheet through the translation of foreign currency debt and cash. This manifests itself in three ways:
- Capital structure mix sometimes expressed as a leverage ratio (net debt to EBITDA) which is a key area to manage both cost of capital and shareholder returns
- Credit metrics used by the Rating Agencies and lenders to determine credit quality, price and availability of debt capital and in some cases covenants.
- The cost of net debt arising from the interest differentials that exist between currencies. For instance at the time of writing it is “cheaper” to borrow Euros than GBP or USD. This of course does not necessarily make it the correct policy to pursue.
We will concentrate on the leverage ratio, i.e. net debt to EBITDA, in the context of our group and the formulation of its FX policy. This ratio is a key credit metric and is also often used to guide externally as to capital structure, allocation of capital and shareholder returns.
Many listed businesses express a leverage ratio range in order to guide the market on how they seek to manage these areas. Figure three illustrates the levels of FX induced volatility in the leverage ratio from our three generic approaches to FX risk management and at different target capital structures. It shows that at lower levels of leverage, i.e. where the ratio of net debt to EBITDA is around 1 or less, there is no material difference in the level of FX exposure to the leverage ratio from the three generic hedging approaches. This intuitively feels correct: low levels of debt translates into lower levels of FX exposure.

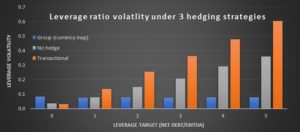
As overall leverage increases, with more currency debt introduced into the mix, a substantial difference emerges between the three hedging approaches. For instance if leverage ratio of around 3x is targeted (consistent with a mid to low “BBB” credit rating), the transactional approach gives rise to an average FX induced volatility of nearly 0.4 in the reported KPI. This means that we could expect the metric to measure vary between 2.8 to 3.2 due to FX rate exposure alone.
In our Monte Carlo simulation, however, the maximum negative outturn was a leverage ratio of 3.8 – something that could have a material effect on the group’s credit rating, borrowing capacity and cost of debt, as leverage of 3.5x is generally around the cross over boundary between an investment grade and high yield borrower. A covenant ratio of 3.5x could be triggered due to FX alone. A business targeting a leverage ratio of around 3, but with covenants and an investment grade credit rating to protect would be well advised to mitigate volatility in its leverage ratio from FX movements.
The FX risk management approach depends on the group’s target capital structure. At lower levels of leverage there is little material impact. In a more highly geared group the FX risk to the leverage ratio becomes material and in these would direct the business towards a currency map approach discussed fully in the article.
Strategic FX exposure
When assessing a business’s overall strategy and competitive position the FX profile of the business can be an important influence. The first step is to understand the impact of FX changes on the business itself. In our example case the group generally benefits from sterling weakness as a substantial amount of its profits are generated in other currencies.
Euros represents the biggest income stream, followed by USD and a small net income in BRL. Because our group displays a divergence between its functional currency reporting and its currency map (see figure one) it is very important management understand this and communicate it clearly to investors and lenders. The group is much more a ‘euro’ play than a ‘dollar’ play, even though in its accounting consolidation its biggest functional currency entity is USD.
The next step is to understand the impact of FX movements on the competitive environment. Table one shows at a very high level the impact of FX changes has on the local marketplace.


Our group is well diversified in terms of the currency of the markets it operates in. The level of concern therefore that arises from the strategic perspective stems from the nature of the competition and whether there are fundamentally alternatives to the USD cost base that our group incurs across its global business.
Our last area to consider is the emerging market exposure arising from the BRL subsidiary. At a high level a currency map hedge approach will protect the value of BRL cash generation over the course of the relevant reporting period. Looking beyond that the group should consider the strategic importance of the operation and its value to the group. This will be based upon growth expectations, but also the level to which the costs in BRL that arise in other parts of the group might evolve in the future. We discussed a value based hedging approach in a previous article on FX risk in emerging markets and this may be relevant where the emerging market is strategically important.
In conclusion
We have briefly covered the broad areas to consider and analyse when formulating an FX policy. By necessity this has been a whirlwind exercise. However the techniques to analyse the level of exposure and the impact of hedging approaches share a common grounding.
In some respects the final policy needs to fit in with even wider concerns such as investor relations and capital structure and even the corporate strategy. There are of course many aspects to the final FX policy but for our example selling forward currency in a profile consistent with the currency map at a multiplier in lone with target leverage would seem the optimal policy.