The yield curve gets surprisingly little focus in the treasury world. Fundamentally treasurers manage cash and debt and the price of this is of course interest. The yield curve dictates what this interest cost is, and in this respect, I quite like the phrase “term structure”, because the yield curve is the representation of the cost of cash through time.
There is a lot of information within a yield curve, yet as a rule I think we give it surprisingly little attention. I am not talking about introducing another arcane tool into the treasurer’s armoury because at its most basic level the yield curve sheds valuable insight into the financial market’s view of the economy in general. It reflects confidence and the consensus opinion as to the future, and this is a very useful strategic tool when we triangulate the information back to our own firm’s business plans. It even reflects the mood music filtering through from our interactions with customers and suppliers.
Figure one introduces the current yield curve (Sterling mid-swaps as at May 5) which shows a shallow upward sloping pattern. The forward rate, ie the applicable rate of interest for each discrete annual period, is shown as a bar chart plot and some of you will still have nightmares about learning how to derive these rates from “bootstrapping” calculations. It’s worth performing however, as it can bring real insight. For instance, simply looking at the swap rate, ie the applicable rate over a whole maturity, can obscure where the market thinks actual interest rates will land over the next few years. Over the short to medium term, let’s say three to five years out, it gives the view of how the market thinks the economy will perform. Figure one shows that the market currently believes that at no time over the next decade will the current interest rate rise above two percent. With a Bank of England inflation target of two percent, the yield curve is telling us that effectively holding cash is value destructive over the entire period. For instance, in 2025, four years from now, the yield curve predicts that the prevailing interest rate will be only one percent.

Figure one: the current GBP yield curve (May 5, 2021)
Implications for treasury and the business
At the time of writing the Bank of England Monetary policy report for May 2021 forecasts inflation of two percent for 2021-2023. Andrew Bailey, Governor of the Bank of England even confirmed a view that inflation could rise to 2.5 percent by the end of the year before falling back again. The current yield curve reflects negative real interest rates, associated with times of recession, for at least the next ten years. The state in its capacity as both government borrower, and central bank investor, is contriving to the distort the market. But surely not, as the yield curve is currently reflecting, on an almost permanent basis?
Let us be clear that what we are considering is the inflection point for the economy. What I mean by this is the point at which the economy starts growing again above the rate of inflation. It is at this point the demand for cash to invest in real assets outstrips supply and interest rates become positive in real terms. With a long-term inflation target of two percent in the UK, this implies an interest rate above this level when confidence in the future returns and Firm’s begin investing cash in real assets again. The current yield curve does not reflect this situation however, and the implication is that interest rates will rise higher than the yield curve in figure one predicts. Several areas where this insight is relevant for treasury and the business are:
- If the economy returns to growth and interest rates rise, then long-term projects financed at today’s rates will look cheap.
- Beware of inflation. Make sure your business is protected because the yield curve is certainly encouraging higher levels of economic activity and concurrent inflation.
- If you are managing a cash portfolio of permanent, or strategic cash, then avoiding locking it up in medium to longer term makes more sense.
- Interest rates could be subject to more volatility than we have become used to. Options may be cheap on this basis if this is not reflected in current premiums.
- As a borrower the downside risk is weighted heavily to rates rising in the future, therefore in interest rate policies which allow a range for the fixed floating mix, now is a time to be towards the heavier end of the fixed scale.
A word of warning though: the above observations are based on the current yield curve shape. Of course, we have been waiting for interest rates to rise since 2008, with several near misses in terms of the start of a rate hiking cycle, although the US did embark on a nascent effort in 2015. As we discussed in a previous article (Interest rate risk: fixed or floating?) there is a strong historic bias to retaining a floating interest rate stance, however the yield curve does look unsustainability low over the medium term and risk is skewed towards rates rising faster than the curve currently reflects.
The yield curve and liability management
I would like to turn attention now to a specific area of treasury interest rate risk management where the payoff in economic terms at least is solely directed by the shape of the yield curve. By way of background liability management (LM) is the process with which the borrower buys back its previously issued fixed rate debt, ie bonds, usually through the issuance of a new, longer dated bond. Holders of the shorter dated bonds being tendered for are enticed to sell up with a premium being offered, expressed as a reduction in the yield on the existing bond, resulting in a higher price for it. Other relevant considerations are the current pricing of the bond being issued under the LM exercise to finance the tender offer (surplus cash is also sometimes used), and the yield curve’s forecast of the coupon of the bond which would be issued in the future if the borrower waited.
The proposed LM exercise in economic terms is a comparison between two scenarios: doing LM or not doing it and waiting until nearer the time of maturity of the existing debt, to refinance it. Overwhelmingly firms take the latter passive course of action, and the reason is simple in that LM rarely makes economic sense for several reasons:
- The tender premium paid to investors, and fees paid to the bank arrangers, are genuine incremental costs that do not occur if the existing debt is not tendered for early.
- If the price paid to tender for the existing bond is above its par value this is a genuine incremental cash cost to the issuer who must finance the difference and ultimately repay it.
- Usually the bond issued under the LM scenario carries a higher coupon than the theoretical future issued bond.
- However, an LM transaction does avoid the cost of carry from holding the grossed-up cash and debt position that the passive route incurs.
Figure two shows a flatter yield curve that we might recognise from pre-quantitative easing times. It reflects a market expectation, easily visible when looking at the forward rates, that the market expects interest rates to rise over the next two years, presumably in response to higher levels of economic growth, and then to fall back thereafter as the economy levels off. The far end of the curve reflects a view that interest rates will hover around the central bank inflation target, ie neutral in terms of economic growth or recession.

Figure two: a flatter yield curve, common pre-quantitative easing
Table one shows how the economics of an LM transaction compare based on the yield curve prevailing today in figure one, and the yield curve from figure two which we have seen commonly in the past and presumably will see again in the future some point. The table shows that for a notional £100m of bond tendered and reissued there is negative net present value of £0.71m under an LM process, but this rises to £1.77m under the flatter yield curve in figure two. The conclusion is that in today’s yield curve environment LM transactions are substantially more attractive than they have been in the past. The primary driver of this is that an upward sloping yield pushes up the coupon of the debt to be issued in the future through a passive refinancing exercise, making the coupon available today, under the LM scenario by comparison more attractive.

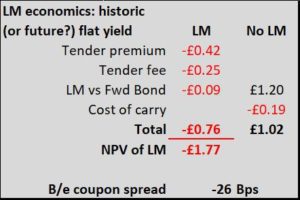
Table one: LM economics look more attractive now than in a flat yield curve environment
Note though that an LM transaction in today’s environment is still NPV negative, due mainly to the tender premium and fees that must be paid. But LM is not just a decision driven by economics in isolation. There are often many other considerations at play such as smoothing any refinancing spikes, overall market conditions and accounting implications.
I hope I have made the case for a regular review of the yield curve. Cranking out the forward curve adds much more value to this exercise, though perhaps ask a friendly bank to do the bootstrapping maths. On the front end of the yield curve these forward rates shed insight into the market’s expectations of economic growth or recession. At the longer end the yield curve is more likely to reflect other influences such as the perception of the underlying economic strength of the economy, inflationary fears or pension scheme demands for longer duration assets. One area though where the treasurer really can use the shape of the yield curve to spot genuine opportunity is in the refinancing of existing debt early through an LM exercise, or by waiting to do so at a date closer to that debt’s maturity. The current yield curve is relatively conducive to an LM exercise because the curve is telling us that waiting to issue new debt in the future will be more expensive than doing so today.