Strategic FX risk management: accurately uncovering exposures
FX risk management can be a highly complex area. Drawing on the insight the Currency Map achieves on underlying FX exposures, we will now develop some strategic considerations when dealing with FX risk management
We closed the last article talking about how the Currency Map method could determine the “perfect” hedge of operational cash flows. This technique maps cashflows across the group by underlying currency independent of how the group is structured in terms of legal entities and their functional currencies. Once the net currency position by currency is known an overlay hedge can be put in place to neutralise this FX exposure. This works regardless of where transactional and translational FX exposures arise in the group.
But the Currency Map also provides the foundation of an understanding of the strategic FX risk that an organisation faces. With the business environment now truly global, the interaction of FX movements on an organisation’s competitive position can be strategic in nature and go to the heart of the operating model. It is often not enough to understand an organisation’s own currency exposures, but to understand those of its competitors and even customers as well. The real point to take on board is that the Currency Map uncovers the true FX exposures within a business and, therefore, acts as the starting point for all subsequent decisions about how to manage them.
The last part of this article describes in detail a “hybrid” Currency Map hedging procedure which addresses practical application.
Why hedge?
FX hedging of business performance, be that profit or cash flow, is not in itself a foregone conclusion. The table below looks at several considerations with arguments for and against:
Different Firms will give different weightings to these factors. For instance, if earnings arise in volatile emerging market currencies then translational FX exposure will be high and might steer toward some form of active income statement risk management. The Currency Map may also reveal that local transactional hedging does indeed reduce overall FX risk to earnings, in which case addressing transactional exposures makes sense. But this is not always the case and the Currency Map is vital to understanding this (see hybrid approach below though).
Strategic FX risk
However, strategic FX risk that arises within the marketplace can trump all other risk factors. The figure below shows how the scale of strategic risk exposure dwarfs the transactional gains or losses. Even domestic only businesses could have this strategic FX exposure through their competitors and suppliers. With market participants navigating the very same FX risks but often from different currency baselines, understanding the impact on competitive position can be vital to a firm’s strategy.
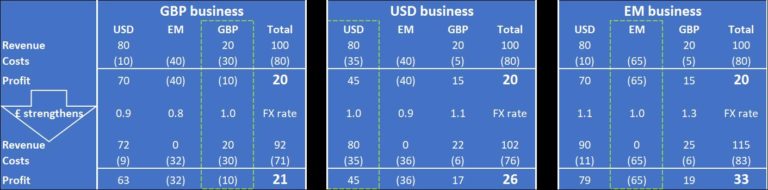
In the example below we present an industry with a total size of £300m, split equally between three competing firms. One based in the UK, one in the US and one from an emerging market (EM). All have exactly a third of the market share and effectively the same cost at today’s exchange rates with all of them making a healthy profit margin of 20 percent. Manufacturing is carried out in the EM country, but different HQ and R&D currency costs prevail in each firm. We have modelled a change in exchange rates, such that sterling strengthens significantly against both the dollar and the EM currency and the USD strengthens against the EM currency. In isolation, the net effect on our sterling business is positive. Its profits increase from £20m to £21m as manufacturing costs in the EM currency fall at a faster rate when translated back to sterling than the decline in USD revenue.
But a look at the Currency Map of the sterling firm’s competitors shows that the exchange rate moves have benefited them far, far more. In fact, the USD firm sees profits increasing by 30 percent, from £20m to £26m, while the EM firm’s saw profits rise by 65 percent from £20m to £33m.
The figure below shows the effect on the UK business’ revenue if its competitors choose to use their FX windfall to undercut pricing and win more market share. The sterling business, without any commercial or hedging mitigation, faces losing 15 percent of its revenue within a year. The FX exposure manifests itself directly through the translation of USD revenue but also indirectly through a decline in its competitive position.
It is important to understand that the FX move is not just an impact on profitability in each of the three market participants. Our UK-based firm is unfortunately now significantly less competitive in the global marketplace after this move in FX rates. In the medium term this could threaten its survival and solvency.
Responses to risk
But what can our UK-based business do? The knee jerk reaction might be to report in USD. The market is dominated by US-based customers and its US-based competitor has benefited from the exchange rate movements. Unfortunately, this would be the wrong response. The firm cannot escape the reality of the FX exposure by changing reporting currency. You will note, however, that it is the Currency Maps of the UK firm’s competitors that draw out the strategic FX risk the firm faces, and not its own Currency Map. The UK firm’s cost base is now a drag on this business in a USD denominated market. Positioning a large part of its cost base in the UK is a strategic decision exposed to FX risk.
While the long-term solution is a strategic problem for the CEO, the treasurer can do two things to fundamentally assist their business to manage this risk:
Identify and quantify the problem
Buy enough time for the business to react
The obvious treasury response for the UK firm is to have sold forward its USD revenues protecting it from some of the FX induced negative impact on revenue. This would allow the firm to subsidise its pricing to retain market share and time for restructuring the cost base.
There are other dimensions to the treasury risk management response which include heavily out of the money options to protect against the extreme movements we have modelled. The balance sheet can provide some protection as well with USD or EM currency debt mitigating some of the operational impact. In the next article we will move onto discuss how the currencies in which an organisation holds its borrowings forms an important part of its FX risk management response.
A hybrid Currency Map approach
There are some disadvantages to the “perfect” hedge that the Currency Map produces which may not be desirable.
Depending on the accounting treatment of the overlay hedge the operating profit margin may be distorted so that it is not reflective of the true margin – this matters in sectors where the margin is closely watched.
Transactional FX gains or losses in individual entities are often undesirable and this may have implications for local performance measurement purposes and for tax. Under the vanilla Currency Map treatment these transactional exposures are left to flow into the overall result.
However, there is a hybrid approach which addresses transactional hedging at the subsidiary level mitigating points both points. The hybrid approach inserts a “treasury” entity into the structure.
The two tables below show the effect of the treasury entity in our very simple group example from the proceeding article. The treasury entity acts as a counter party to the subsidiaries in mitigating their transactional FX exposures (in yellow). In addition is transacts the Currency Map hedge for the group (in green).
It is no coincidence that the treasury entity is ultimately selling the entire profit of £46m USD equivalent that arises in the foreign currency entity in the group – This is logical. The transactional hedge in place removes any FX exposure at subsidiary level effectively making each subsidiary now a “pure play” functional currency concern. This hybrid approach both removes transactional exposure in the operating subsidiaries and produces the expected cash flow result overall for the group.