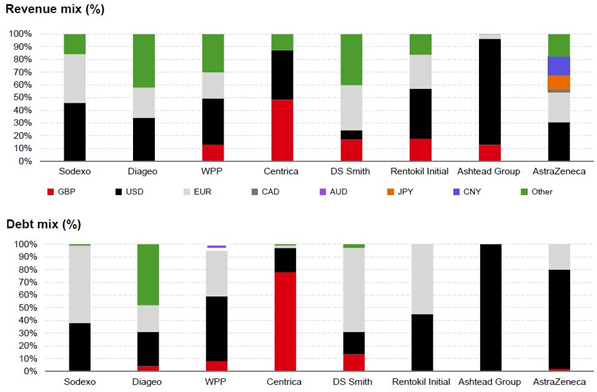
The approach many corporates take is to borrow against future cash flows or earnings (often EBITDA) particularly where the business is asset-light in nature and shareholder value is more closely linked to cash flow generation as opposed to the book value of assets. The figure below has been taken from the Annual Reports of several blue-chip companies and shows the currencies of borrowings and revenue. Some high-level conclusions from this figure are:
- The currency profile of revenue (a proxy for cash flow) influences the currency profile of debt – this is probably the starting point for currency apportionment of debt.
- The cost of currency borrowing then clearly influences the profile:
- Cheaper Euro debt features heavily in several firms
- Expensive emerging market debt is marked by its absence (Diageo excepted) despite several firms generating significant revenue in these currencies
- Book value of assets can also influence the debt profile, with Diageo citing currency borrowings as a tool in managing the Value at Risk of its assets (mainly brands).

Treasury policies will often accommodate some level judgement to allow for the influences of interest cost and asset values to be super-imposed on a level of debt determined from the currency cash flow profile. It is also important to understand that the effective currency of borrowing is a combination of debt directly raised in currency and derivative overlays from instruments such as cross currency swaps or forward foreign exchange contracts to create an effective currency of borrowing.
Pulling the right levers
We will now focus on balance sheet leverage defined as net debt to EBITDA, as this KPI is fundamental in credit rating agency and lender analysis. Targeting a level of balance sheet leverage (the leverage ratio) is usually a core strategic decision. Successfully managing the leverage ratio contributes towards the following areas:

The typical formulation of an overall leverage ratio target will see the corporate plan for an appropriate level of CAPEX, M&A and dividends in conjunction with its forecast or budget for operating cash flows and EBITDA over a period. We have through our discussion of the Currency Mapping in previous articles described how FX risk can minimised in the EBITDA side of the leverage ratio equation.
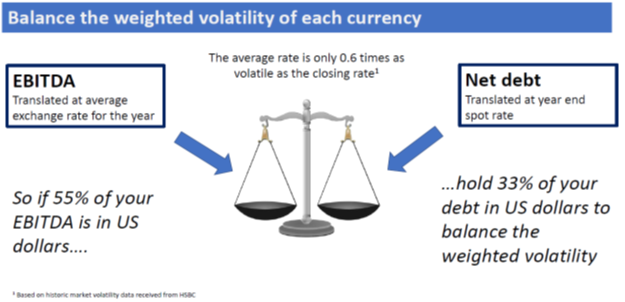
FX exposure to the leverage ratio arises because cash flows and EBITDA are translated at the average exchange rate for the period, whereas debt is translated at closing rate at the reporting period end. The different exchange rates used to translate the two inputs into the leverage ratio can cause variations in the ratio even if levels of currency debt and EBITDA are delivered exactly to target under the operational plan. And the reason is very simple – the average exchange rate used for cash denominator (EBITDA) is less volatile within an annual reporting cycle than the closing exchange rate used to translate the numerator (debt). This effect is illustrated below.

The figure above illustrates that the FX exposure arises at a proportionally higher volatility in the closing rate at which debt is translated in the financial statements, compared to the volatility at which the average rate which is applied to the translation of earnings and cash. The approach, therefore, to minimising the exposure of the leverage ratio to FX risk is to balance the weighted volatility of currency debt to the weighted volatility of that currencies EBITDA:
| Annual volatility of Ccy x % debt |
= |
Average rate volatility of Ccy x % EBITDA |
Solving for % debt:
| Average rate volatility/annual volatility x % EBITDA |
= |
% debt |
For example:
| 6% (ave rate vol) / 10% (closing rate vol) x 40% (e.g. USD EBITDA) |
= |
24% USD debt |
The annual volatilities of different currencies are available from market data providers or often from a quick phone call to a relationship bank. Average rate volatilities are simply taken as being around 0.5-0.6 of the annual volatility. The appendix to this article goes into a technical discussion of this weighted volatility approach.
Application of this principle
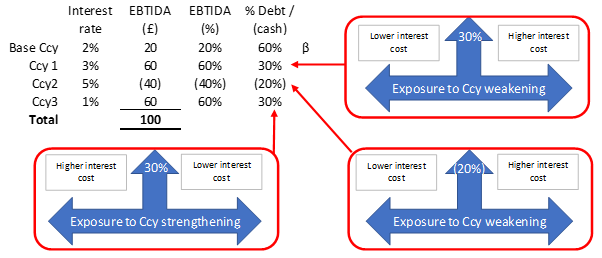
Clearly across the infinite range of exchange rate scenarios that can play out over the course of a reporting period alternative currency debt mixes will under or over perform against others and indeed the expected ideal. However, the approach described above allows the corporate to carry out a meaningful analysis of FX risk to its balance sheet leverage ratio. The figure below shows how this might be used in practice where the currency of debt question is boiled down into a classic risk versus reward (or in this case interest cost) decision.
If the firm’s objective is simply to lower the FX risk to its leverage ratio, then the optimal proportion currency within its debt is shown in the last column. For example, 30 percent of the firm’s debt should be held in Ccy1, offsetting the 60 percent of EBITDA held in this currency. However, Ccy1 comes with a high interest cost: there is a one percent interest differential between this and interest rate in the reporting base currency (three percent – two percent). As each box illustrates, moving towards a lower interest cost, in the case of Ccy1 by borrowing less than 30 percent of debt in this currency, exposes the leverage ratio to more volatility.

A counter argument
The technique described is suitable if you take the view that there is not a long-term direction to the exchange rate between the base currency and the operating currency in question. Borrowing in a proportion significantly different to the level of cash or EBITDA generation could expose the firm in the medium to longer term to a dislocation of the leverage ratio resulting from this trend in the FX rate. The approach minimises volatility in a discrete period, usually a year. As such it is most applicable to developed world currencies where directional trends over long periods of time tend to be muted. Currencies exposed to high interest and inflation rates such as emerging market currencies can still benefit from the approach. However, where they make up a significant element of the business, additional risk management and analysis may need to be performed to take this into account.
Understanding the risk and the tools available to manage it allows management to make informed decisions that over time should produce a more stable and targeted reported leverage ratio and benefit the creation of shareholder value. The approach suggested is a balanced judgement of the cost of debt or the weighting book asset values are given by investors versus the quantum of the FX exposure it brings with it to a key balance sheet KPI such as leverage. In the next article, we will consider how FX exposures within operational cashflows and debt interact, and how to create a coherent FX risk management approach across the many faceted issues that FX risk management involves.
Appendix: dissecting the leverage ratio exposure
Objective is to prove that holding debt in currency in approximately a 50% ratio to the currencies proportion of EBITDA results in less volatility to the leverage ratio reported at period end.
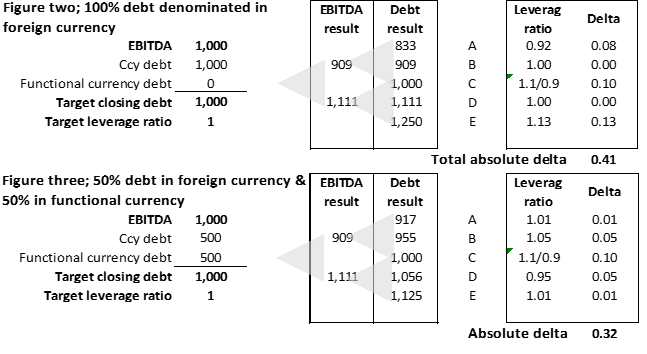
Our scenario is set up in figure one below and shows a firm with EBITDA of 1,000, generated entirely in foreign currency, and a targeted leverage ratio of 1, implying debt of 1,000 at the reporting period end. For simplicity the expected exchange rate (ER) is 1. Five FX scenarios have been modelled, A-E. For example, scenario A shows the expected rate of 1 moving to a closing rate of 1.2 by the year end and an average rate of 1.1. Our five exchange rate scenarios model an average exchange rate of between 0.9-1.1 and a closing exchange rate within a range of 0.8-1.2.

Figures two and three are identical apart from one crucial difference: the debt portfolio in figure two is made up entirely of the same currencies and in the same proportions as EBITDA. In figure three 50% of debt is held in the reporting currency of the firm and is therefore not subject to any FX risk.

Running these debt portfolios through our exchange rate scenarios A-E, results in the leverage ratio outcomes shown the two boxes to the right in figures two and three. Reported EBITDA is the same in both figures two and three. It is the closing value of debt, when translated back into reporting currency that differs. However, the 50:50 debt mix (figure three), compared to the 100% currency debt mix (figure two) results in lower average volatility (absolute delta) and lower maximum and minimum outcomes to the leverage ratio.


